From Data To Design Using Analytics To Improve UX
In the rapidly evolving digital landscape, user experience (UX) has become a critical differentiator for brands. A well-designed user interface can make the difference between a loyal customer and a lost opportunity.


In the rapidly evolving digital landscape, user experience (UX) has become a critical differentiator for brands. A well-designed user interface can make the difference between a loyal customer and a lost opportunity.
But how do you know if your design is resonating with your audience?
The answer lies in data analytics.
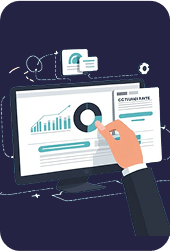
By leveraging data, businesses can make informed decisions that lead to better UX, ultimately driving higher engagement, conversion rates, and customer satisfaction.

Understanding the Role of Data in UX Design
UX design has traditionally been seen as a creative discipline. However, in today’s data-driven world, creativity must be balanced with analytical insights. Data provides concrete evidence of how users interact with your product or website, allowing designers to move beyond assumptions and personal preferences to make decisions based on actual user behavior.
Analytics can inform every stage of the design process:
- User Research: Data can help identify who your users are, what they need, and how they behave online. This information is essential for creating user personas and understanding the context in which your product will be used.
- Prototyping and Testing: Once a design is created, data can be used to test its effectiveness. A/B testing, heatmaps, and user journey analytics can reveal which design elements work and which don’t, enabling iterative improvements.
- Post-Launch Analysis: After a design is live, data continues to play a crucial role. Analytics can track how users are interacting with the design, where they drop off, and what elements are driving engagement. This ongoing feedback loop is essential for maintaining and improving UX over time.
Key Metrics of UX Design
Not all data is created equal. To effectively use analytics to improve UX, it’s important to focus on the metrics that matter.
Here are some key metrics to consider:

Bounce Rate:
This metric shows the percentage of users who leave a site after viewing only one page. A high bounce rate might indicate that users aren’t finding what they’re looking for or that the page is not engaging enough.

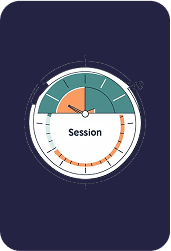
Session Duration:
This measures how long users stay on your site or app. Longer sessions typically indicate that users find the content valuable and are engaging deeply with the design.

Click-Through Rate (CTR):
CTR measures the effectiveness of links or calls to action (CTAs). A low CTR may suggest that the design isn’t compelling enough or that the CTA isn’t clear.

Heatmaps:
Heatmaps provide a visual representation of where users click, scroll, or hover on a page. This data can highlight which parts of a design are attracting attention and which are being ignored.

Conversion Rate:
Perhaps the most critical metric, the conversion rate measures the percentage of users who complete a desired action, such as making a purchase or signing up for a newsletter. Improving UX design often directly correlates with higher conversion rates.

How to Use Data to Drive UX Improvements
- Identify Pain Points: Use analytics to pinpoint where users are struggling. High drop-off rates, low engagement, or frequent use of the back button can signal UX issues that need addressing.
- A/B Testing: A/B testing allows you to compare two versions of a design element to see which performs better. By continually testing and iterating, you can refine your UX to better meet user needs.
- Personalization: Data can help you understand different user segments and tailor the UX accordingly. Personalized experiences can significantly improve engagement and satisfaction.
- Iterative Design: UX design should be seen as an ongoing process rather than a one-time project. Continuously collect data, analyze it, and make adjustments to keep your design aligned with user expectations.
- Collaborate Across Teams: Data-driven UX design requires collaboration between designers, developers, and data analysts. By working together, these teams can ensure that design decisions are informed by comprehensive insights, leading to a more cohesive and effective user experience.

The Future of Data-Driven UX Design
As technology continues to advance, the relationship between data and design will only grow stronger. Machine learning and artificial intelligence are already being used to predict user behavior and personalize experiences in real time. In the future, we can expect even more sophisticated tools that will enable designers to create highly intuitive, responsive, and user-centered designs.
However, while data is a powerful tool, it’s important to remember that it should complement, not replace, human intuition and creativity. The best UX designs come from a balance of data-driven insights and innovative thinking.
Conclusion
Using analytics to improve UX is no longer optional—it’s essential. By integrating data into the design process, businesses can create user experiences that are not only visually appealing but also highly effective. The result is a product or website that meets user needs, drives engagement, and ultimately contributes to the success of the business.
Whether you’re just starting out or looking to refine an existing design, make data your ally. The insights you gain will lead to better decisions, happier users, and a stronger brand.
